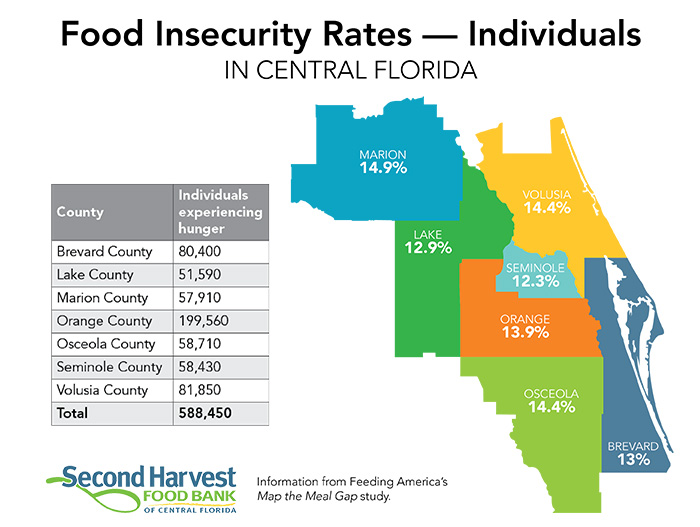
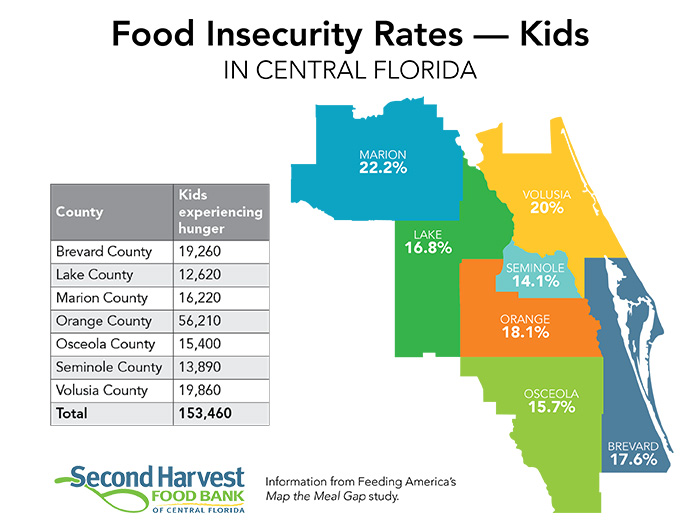
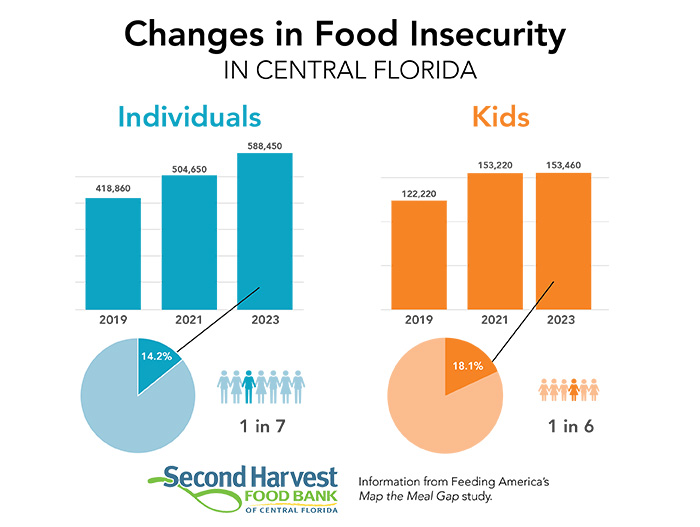
According to Feeding America’s Map the Meal Gap 2025 Report, 588,450 individuals, or 1 in 7 neighbors, across Second Harvest Food Bank’s seven-county service area are food insecure. This number includes 153,460 children, which equates to 1 in 6 kids. Every county in the region has neighbors experiencing food insecurity and several – such as Marion, Osceola and Volusia – report rates that exceed the national average.
Hunger affects people of all backgrounds and communities in Central Florida. However, long-standing barriers to opportunity – such as income inequality, housing costs, and limited access to resources – more severely impact some groups of people than others. In Central Florida, data indicates that 26% of Black residents and 18% of Hispanic residents experience food insecurity, compared to 11% of white residents. These disparities reflect broader challenges, not individual choices. Focusing on the needs of those most impacted makes it possible to build solutions that reduce hunger for everyone.
Childhood hunger has far-reaching consequences. It hinders a child's ability to learn, grow, and thrive, negatively affecting their health, emotional development, and educational success. In two Central Florida counties, childhood hunger rates exceed the national average of nearly 20%. Specifically, Marion County has a rate of 22.2%, and Volusia County has a rate of 20%, meaning that almost 1 in 5 children live in households with strained budgets amid growing economic pressures. Addressing child hunger is a moral imperative and a crucial investment in the future.
Food insecurity also affects older adults and seniors, many of whom live on fixed incomes. In the Orlando-Kissimmee-Sanford metro area:
5.4% of seniors (60+) experience food insecurity
6.3% of adults ages 50-59 are food insecure
Although these rates are lower than both the state and national averages, they still indicate a significant need for charitable food assistance as housing, healthcare, and food costs continue to rise.
High grocery prices remain a challenge for many families. In 2023, the average person experiencing food insecurity needed an additional $22.37 per week to afford enough food. This gap adds up to a regional annual meal shortfall of more than 111 million meals, according to estimates from Feeding America. The national food budget shortfall now exceeds $32 billion, up 55% since 2020.
Not everyone facing hunger qualifies for federal nutrition assistance programs. In Central Florida, 35.6% of food-insecure individuals are unlikely to qualify for the Supplemental Nutrition Assistance Program (SNAP) because their income is just above the threshold. Even among those who qualify, SNAP benefits often do not cover the full cost of a meal. In 99% of U.S. counties, SNAP benefits fall short. As a result, food banks and feeding partners remain essential lifelines, especially for working families, seniors and others who fall through the cracks.
These findings reinforce what Second Harvest Food Bank of Central Florida hears every day from neighbors: the need for food assistance remains high, and no solution is one-size-fits-all. This data helps inform where and how resources are deployed into the community, whether through school partnerships to reach students and families, mobile food distributions in rural areas, or nutrition programs for seniors. By using this data to guide hunger relief efforts, Second Harvest and its supporters, partners and volunteers can better support neighbors facing hunger and build a stronger, more resilient community for all.
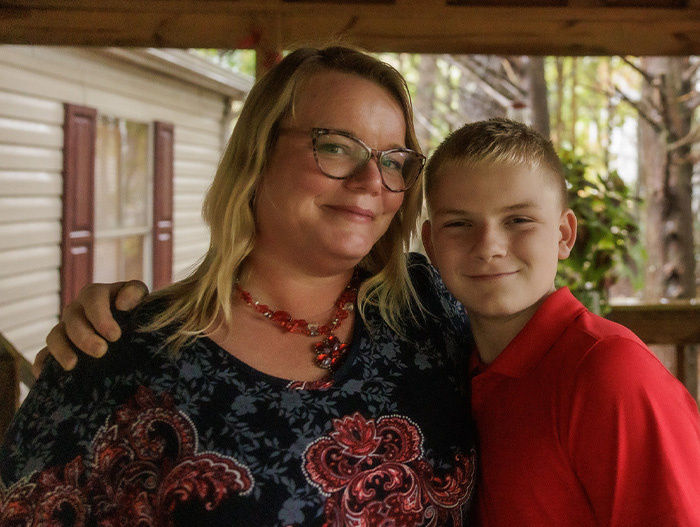
Meet the neighbors, partners and volunteers who bring our mission to life. These stories highlight how your support helps fight hunger, fuel futures and strengthen communities — one meal at a time.